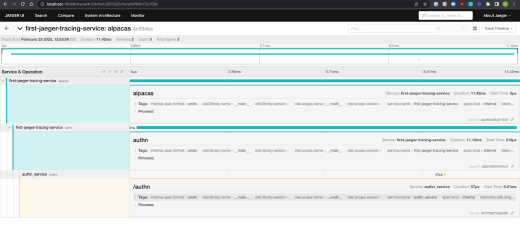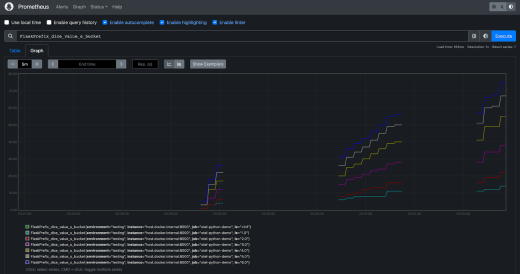
The three pillars of observability are logging, metrics, and tracing:
Logging is having your service emit messages (logs) at specific points in time.
Metrics is making and recording certain measurements of your service at specific points in time.
Tracing is chaining together the calls your service makes, both calls between functions within your service and calls made between your service and others.
These three different ways of observing your service allow you to gain a better perspective of how your service is running and where possible bottlenecks could be. Good observability is also an extremely useful support for data quality.
Today I’m going to talk about the first of the three pillars of observability, logging, at a high level. My goal with this tutorial is to give you a decent starting point for figuring out what’s happening in your application or service. As part of that, I’ll go over a small Python service and a typical route for setting up the logging form of observability.
When writing logs they can end up in different places, such as stdout being piped to your terminal or in a log file that you specify. Since logging to either the terminal or log files can be short-lived, logs can generally be aggregated by a service for longer-term storage.
These log aggregators, paired with parsers and querying services, allow you to better search logs based on the fields they contain.
To create our log, let's start off with a basic Flask app.
Set up a virtual environment to isolate this tutorial if you don't already have one, and then run the following:
1pip install flask
Create a file called app.py with the following content:
1# app.py2
3from flask import Flask4
5
6app = Flask(__name__)7
8
9@app.route("/observability")10def observability():11    return "Hello, Observability!"
Set the environment variable export FLASK_APP=app and run flask run to start the app.
If you now go to localhost:5000/observability in your browser, you should see Hello, Observability!.
Now that we have some scaffolding to work with, let's start logging.
Send it to stdout
For your first logging, you might be tempted to write logs to standard out with print statements, since this is one of the first things that we learn to do in any programming language. That would look something like:
1from flask import Flask2
3app = Flask(__name__)4
5
6@app.route("/observability")7def observability():8    return "Hello, Observability"9
10
11@app.route("/print")12def stdout():13    print("Writing to stdout via a print statement!")14    return "Basic Logging via Print"
This works because the service will emit a log when it hits the /print endpoint.
But there are still a few drawbacks to this approach:
The format of the log is pure text, but the general standard for logs is JSON.
When messages get too long, pure text can be messy, especially if we also want to parse it and see if specific fields are present.
Let's make these logs a little easier on the eyes.
Make the logs more readable
JSON is the current machine-parsable format of choice for logs, which will allow tools such as DataDog to more easily search by fields and index on specific fields automatically.
Most log aggregators and visualization tools will allow you to search through JSON-formatted logs out of the box as well. If you must log without JSON formatting, then you can generally write parsers or processors yourself, but that can be time-consuming.
So let's generate our logs as JSON to save time and effort.
In this example, we’ll use a logging package that we use here at Great Expectations, structlog.
Run pip install structlog in your working directory to install the structlog package.
With structlog, we can specify:
The structure for all of our logs
What format we would like the logs to be in
Their processor configuration.
We can set that up with the following code block.
1import structlog2
3from flask import Flask4
5structlog.configure(6    processors=[7        structlog.processors.JSONRenderer(),8    ]9)10log = structlog.get_logger()11
12app = Flask(__name__)13
14
15@app.route("/observability")16def observability():17    return "Hello, Observability"18
19@app.route("/stdout")20def stdout():21    print("Writing to stdout as a log message!")22    return "Basic Logging"23
24@app.route("/jsonlog")25def log_it_out():26    log.warning("One Sweet JSON Formatted Log")27    return "Logging json logs"
In this code block, we added the import for structlog, the initialization and formatting of structlog messages, and a log statement using structlog instead of print.
Passing the structlog config to the JSON renderer processor takes the fields specified for a log and outputs them in a JSON format.
Now when we go to the localhost:5000/jsonlog in the browser, we should see a log in the console that looks like this:
1{"event": "One sweet JSON log"}
As we can see, the message that log.warning produced is the value for the event key in the JSON log. This is a good start, but let’s add standard fields that will be present in each log.
Standardize what is emitted to the logs
Let's make these logs a bit more robust. With standard fields, we’ll have context when there are many logs from many services.
Here are some fields that we want each log message to have:
Service name
Environment
Timestamp of the request
Endpoint requested
User IP
User Agent
We can add these fields to the log by creating our own processor to insert them. This results in our final code block below:
1from typing import Any, MutableMapping2
3import structlog4from flask import Flask, request5
6
7def standard_field_adder(8    logger: structlog.types.WrappedLogger,9    method_name: str,10    event_dict: MutableMapping[str, Any],11):12    event_dict["env"] = "local"13    event_dict["service"] = "logging-tutorial"14    event_dict["user-agent"] = request.user_agent15    event_dict["ip"] = request.remote_addr16    event_dict["url"] = request.url17    event_dict["method"] = request.method18    return event_dict19
20
21structlog.configure(22    processors=[23        structlog.processors.TimeStamper(fmt="iso"),24        standard_field_adder,25        structlog.processors.JSONRenderer(),26    ]27)28log = structlog.get_logger()29
30app = Flask(__name__)31
32
33@app.route("/observability")34def observability():35    return "Hello, Observability"36
37
38@app.route("/stdout")39def stdout():40    print("Writing to stdout as a log message!")41    return "Basic Logging"42
43
44@app.route("/jsonlog")45def log_it_out():46    log.warning("One sweet JSON log")47    return "Logging to json logs"
After writing the following code to your app.py file, you can run flask run. You should get a log message similar to this in the console:
1{"event": "One sweet JSON log", "timestamp": "2023-01-03T23:15:39.501157Z", "env": "local", "service": "logging-tutorial", "user-agent": "<UserAgent None/None>", "ip": "127.0.0.1", "url": "http://localhost:5000/jsonlog", "method": "GET"}
We now have a core log message that will be helpful for troubleshooting our services. We can see log messages in historical order, and use the timestamp to locate when errors started occurring.
The user agent can help us see if all the errors are coming from a specific browser; with a user_id, we can see if the errors are occurring for a specific user.
In the next section, we'll go over the basics of what should be logged.
Best practices for logging
Over the past decade, I’ve set up and worked on systems in a variety of industries, from small greenfield startups to systems that aggregated billions of events.
There are some fields that I’ve found to be the baseline for effective logging, and I use them in my first pass whenever I’m implementing new logging for any service:
Service name
Log level
Timestamp
Host that processed the query
For web-server-specific logging, I suggest adding the following fields as well:
Request ID or Correlation ID
Path
Request method
Request Payload, if it does not include PII
User IP
User agent
Full request latency
Requester User ID
Request Authentication Status
Request Authentication Method, if multiple are used
NOTE: Please do not log out sensitive data or PII. This means that, on a regular basis, you need to ensure that no passwords, secrets, or customer data are being stored in your logs. You can set up a custom processor to help by excluding certain fields for you.
With these fields as your template, you can triangulate most issues. They’re also very helpful for querying if you’re using a log aggregator that allows you to query by logs or set up dashboards.
Once your system is baked, you’ll find other fields that should be added for your specific purposes. Learning how to do effective logging is one of the biggest parts of mastering the software development lifecycle, especially stages like supporting and hardening.
Thanks for coming along on this observability journey! You can download this tutorial here.


