The three pillars of observability are:
Logging: your service emits informative messages that communicate user and system behavior.
Metrics: make and record certain measurements of your service at specific points in time.
Tracing: chaining together the calls your service makes, both calls between functions within your service and calls made between your service and others.
Today, we'll be focusing on metrics.
Metrics are useful to us because, by structuring these measurements as time-series data, we can explore how systems change over time. Visualizing these changes over time is useful, particularly if you annotate your visualizations to correlate observed metric values with different events.
Usually, major changes in metric values are linked to specific events: for instance, a spike in new deployments after a major marketing push or funding round that made it to the top of HackerNews.
Metrics on the aspects of your services related to the transmission of your data—particularly those when the data is created or modified—can similarly identify events that may impact your data quality.
Once you’re observing your metrics, you can progress from reactive examination of past metrics to active monitoring, where you’re alerted if thresholds are breached.
Let's go through a simple exercise with Flask to get acquainted with metrics.
Choose a framework
In order to start producing metrics, we need a framework. For this example, we’ll use OpenTelemetry (OTLP), an open source framework for logging, metrics, and tracing that allows you to write metrics once and export them to many different metric aggregation providers.
Having this flexibility is useful for several reasons:
If you change providers, you don’t have to change your framework.
Metrics can be written consistently across your organization even if different teams use different aggregation providers.
A common open source aggregation provider is Prometheus; some popular paid options are DataDog and Splunk.
We’ll use Prometheus as the aggregation provider for this example: it provides an easy way to get started with a new instance for free.
Set up a basic Flask app to emit metrics
For this example, we’ll create a simple endpoint that simulates a dice roll for a 6-sided die, using Flask as we did in the logging tutorial. The code for this metrics tutorial can be found here.
To set up the app:
Ensure Docker is installed.
Ensure you have Python installed. I used Python 3.9.16.
Clone the tutorial code from GitHub and run
Run
Create a file named app.py and place the following code inside of it:
1from random import randint2from flask import Flask3
4app=Flask(__name__)5
6@app.route("/rolldice")7def roll_dice():8  return str(do_roll())9
10def do_roll():11  roll = randint(1, 6)12  return roll
This code creates a basic Flask app. Its single endpoint, /rolldice, calls the do_roll function and returns a dice value. This is done using the randint function from the random package.
Start your app by running:
1flask run --reloadNow, if you navigate to the page http://localhost:5000/diceroll, you’ll see a random dice roll value on the page. Every time you refresh your browser, a new roll will be generated, and you’ll see the value begin to change as you repeatedly refresh the page. The more times you refresh here, the more data there will be to see in your graph later.
Stop the app by pressing Ctrl+c where you had run the Flask command. Now you’re ready to create metrics for it.
Types of metrics
There are three main categories of metrics:
Counters: Monotonic measurements, which only increase, only decrease, or reset to 0. These are generally used if you are getting the number of requests to a service or DB. You can run a rate() query on them which will generally give you the requests per second, which is often useful.
Gauge: Single values that can go up or down and are not dependent on any previous value. They’re useful for measuring things like current mem/cpu usage, IoT temperature observations, or the number of concurrent jobs being run.
Histogram: A sample of observations counted into buckets. Histograms are useful for seeing the latencies for requests or payload sizes for a request.
Add the first metric: endpoint request count
Now let’s add our first metric: using a counter to see how many times our endpoint has been called. We’ll do that by:
Starting the local Prometheus server to emit metrics from the app.
Setting up the OpenTelemetry config.
Setting up the Prometheus server to pull metrics and view metrics.
Instrumenting an endpoint to increment a counter.
Edit your app.py to look like the following:
1from random import randint2from flask import Flask3
4import prometheus_client5from opentelemetry.exporter.prometheus import PrometheusMetricReader6from opentelemetry.metrics import get_meter_provider,set_meter_provider7from opentelemetry.sdk.metrics import MeterProvider8
9# Start Prometheus client10prometheus_client.start_http_server(port=8000, addr='0.0.0.0')11# Exporter to export metrics to Prometheus12prefix = "FlaskPrefix"13reader = PrometheusMetricReader(prefix)14# Meter is responsible for creating and recording metrics15set_meter_provider(MeterProvider(metric_readers=[reader]))16meter=get_meter_provider().get_meter("myapp","0.1.2")17
18# Create a counter19counter = meter.create_counter(20    name = "requests",21    description = "The number of requests the endpoint has had"22)23
24# Labels can be used to easily identify metrics and add further fields to filter on25labels = {"environment": "testing"}26
27@app.route("/rolldice")28def roll_dice():29  return str(do_roll())30
31@app.route("/rolldicecounter")32def roll_dice_counter():33  roll_value = do_roll()34  counter.add(1, labels)35  return str(roll_value)36
37def do_roll():38  roll = randint(1,6)39  return roll
Now, run the Flask app using flask run.
You can see a metrics server with the metrics emitted at http:localhost:8000/metrics. These are the metrics that will soon be pulled by the Prometheus server and aggregated so that we can view them.
Having all the metrics in a single place is especially helpful when you have multiple instances of an app emitting metrics. Once you get to having multiple instances of your app, you should also ensure that you tag your metrics by instance so that you can see if there are any trends in your metrics that are instance-specific.
Start up the Prometheus aggregation server by running the following:
1docker run --rm --name prometheus \2 -p 9090:9090 \3 -v $(pwd)/prometheus.yml:/etc/prometheus/prometheus.yml \ 4 prom/prometheusNow if you go to http://localhost:9090, you’ll see a UI where you can issue a Prometheus Query Language (PQL) query to see your counter values.
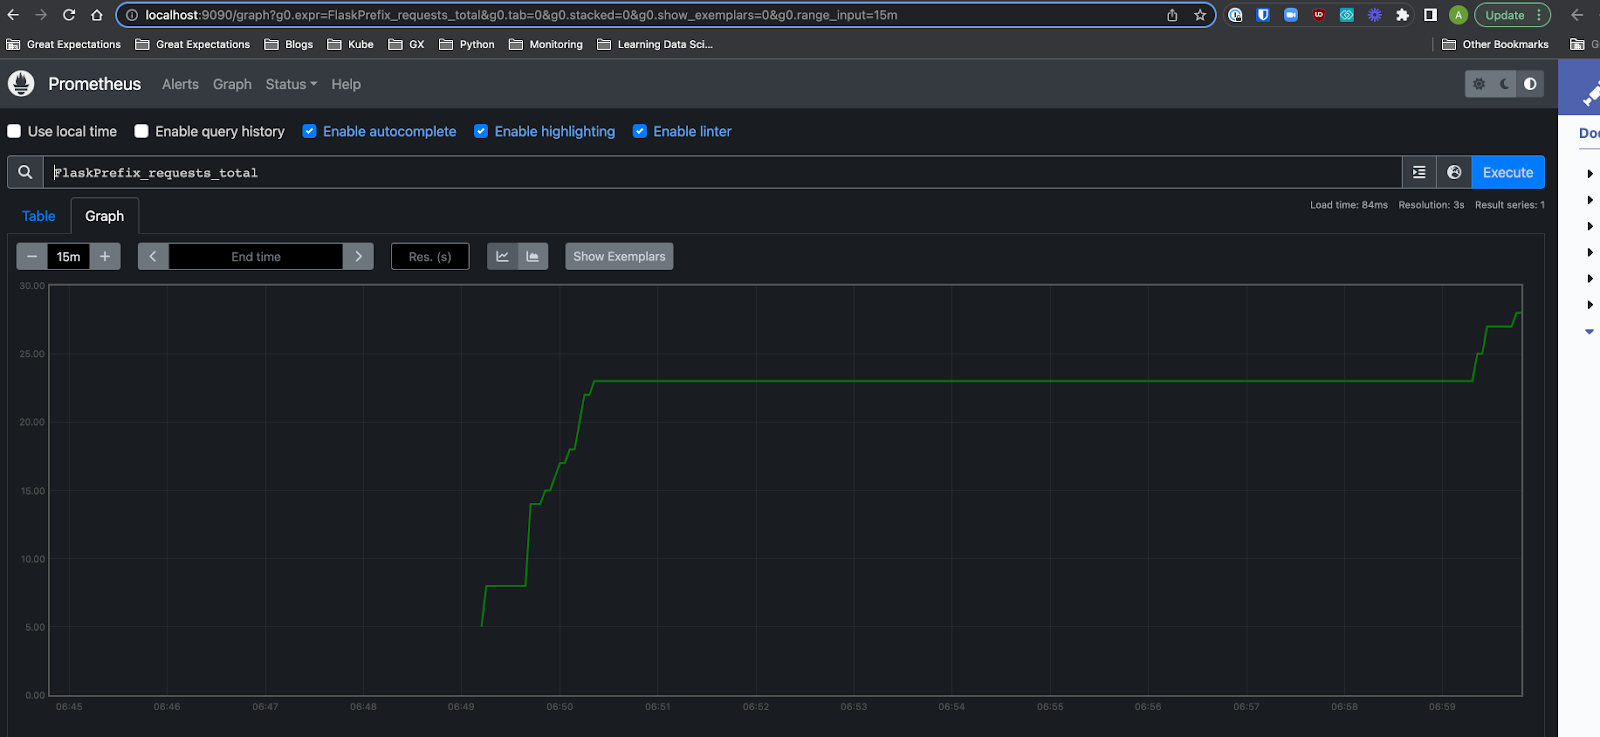
Issue the following query in the UI:
1FlaskPrefix_requests_totalYour browser should now have a graph that looks similar to the one below, but with the count of how many requests you have made to your endpoint.

Add second metric: distribution of dice roll values histogram
For our second metric, we’ll explore using the histogram metric type.
A histogram is a metric that allows you to categorize the counts of your emitted values into buckets, where the values in the bucket are less than or equal to the bucket’s value.
The bucket value is denoted in Prometheus as the le label. So for a bucket that counts the values that are less than or equal to five, the Prometheus label would be le=5.
We’ll use a histogram to measure the dice roll values as the values will fit nicely into buckets that we can predefine, since we know the series of values that we can receive.
One thing to note when initially instrumenting histograms is that default buckets can be very broad, which might not really give you any insights into your data.
For instance, if we're expecting our values to be from 1-6 but the buckets are set up to have values of [0, 5, 10, 100, 1000, 2500], then we really won’t see any meaningful distribution since the bucket values dwarf the expected values.
In order to add the histogram we will need to do the following:
Import the opentelemetry.sdk.metrics.view package.
Add a new view to the MeterProvider to add custom histogram buckets.
Add a metric of type histogram.
Add a new endpoint to emit a histogram metric.
Update app.py file to look like the following:
1from random import randint2from flask import Flask3
4import prometheus_client5from opentelemetry.exporter.prometheus import PrometheusMetricReader6from opentelemetry.metrics import get_meter_provider,set_meter_provider7from opentelemetry.sdk.metrics import MeterProvider8from opentelemetry.sdk.metrics.view import ExplicitBucketHistogramAggregation, View9
10# Start Prometheus client11prometheus_client.start_http_server(port=8000, addr='0.0.0.0')12# Exporter to export metrics to Prometheus13prefix = "FlaskPrefix"14reader = PrometheusMetricReader(prefix)15# Meter is responsible for creating and recording metrics16provider = MeterProvider(17  metric_readers=[reader],18  views=[View(19    instrument_name="*",20    aggregation=ExplicitBucketHistogramAggregation(21      (1.0, 2.0, 3.0, 4.0, 5.0, 6.0)22    ))],23)24set_meter_provider(provider)25meter = get_meter_provider().get_meter("myapp", "0.1.2")26
27# Create a counter28counter = meter.create_counter(29    name="requests",30    description="The number of requests the app has had"31)32
33dicevalue = meter.create_histogram(34  name="dice_value",35  unit="s",36  description="Value of the dice rolls"37)38
39# Labels can be used to easily identify metrics and add further fields to filter by40labels = {"environment": "testing"}41
42app = Flask(__name__)43
44@app.route("/rolldice")45def roll_dice():46  return str(do_roll())47
48@app.route("/rolldicecounter")49def roll_dice_counter():50  roll_value = do_roll()51  counter.add(1, labels)52  return str(roll_value)53
54@app.route("/rolldicehistogram")55def roll_dice_gauge():56  roll_value = do_roll() 57  dicevalue.record(roll_value, labels)58  return str(roll_value)59
60def do_roll():61  roll = randint(1,6)62  return roll
Now you can run flask run once again and head over to localhost:5000/rolldicehistogram to start generating some metrics: hit refresh to call the endpoint a dozen or more times.
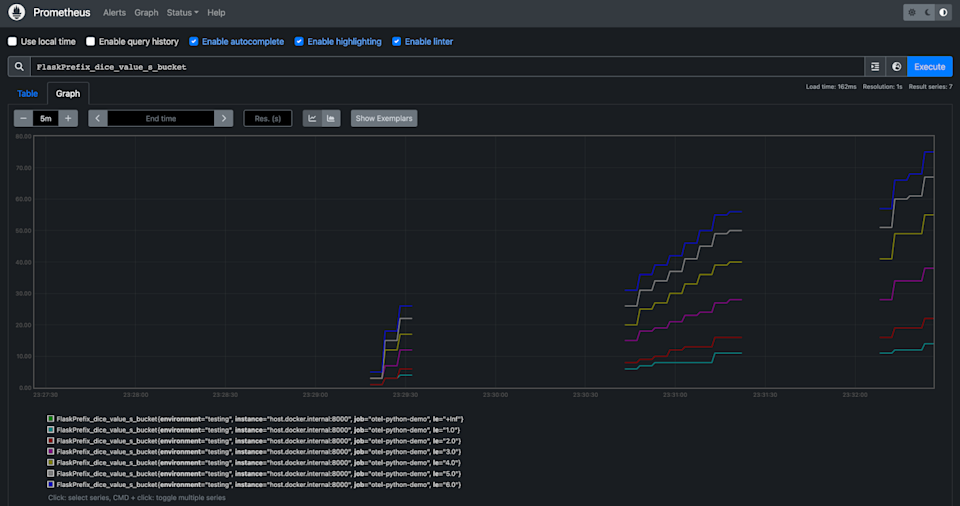
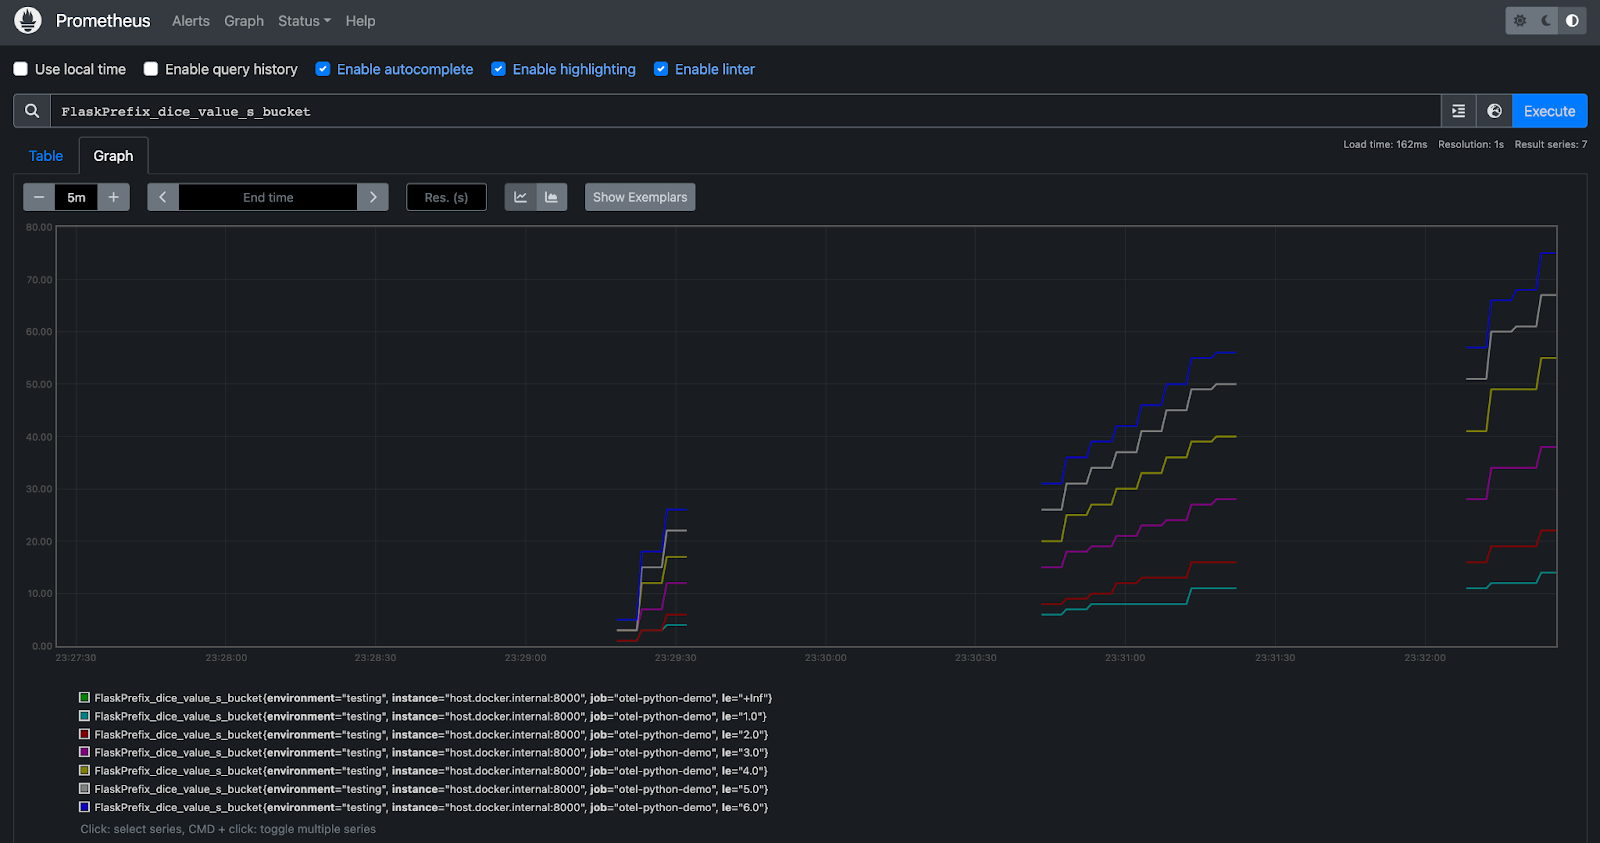
Go back to localhost:9090 and enter the query FlaskPrefix_dice_value_s_bucket, and you should see a graph like the one below.
As we expected, the distribution of values in the dice rolls is rather even, and the count values for each are going up over time.

Percentile metrics
One thing that’s super helpful to understand for troubleshooting or profiling your app is percentiles. A percentile helps you characterize your overall distribution of values. Specifically, it identifies the value that is associated with a certain percentage of the overall value count, when all values are arranged from least to greatest.
A percentile is usually expressed as a P followed by the relevant percentage number. So the 95th percentile is P95; if your P95 for a request is 1.35 seconds, then 95% of your requests are taking 1.35 seconds or less. If your P75 is 1.1 seconds, then 75% of requests take 1.1 seconds or less.
The most common percentiles to track are P50 (the median), P75, P95, and P99, along with monitors to alert you if the associated values go over a certain threshold. These thresholds are generally associated with your SLOs and SLAs.
Having a good grasp of what these values mean can allow you to do spot checks faster for your system. The percentiles are super useful for this: we can get good estimates of our traffic using them without having to be too precise. Instead of looking at every metric emitted, we just need to look at the aggregate metric.
I recommend adding a dashboard for your team that tracks the changes in these metrics over time, and reviewing it each day to see how your systems are performing. If you’re working on a growing product, this kind of tracking can be key for guiding you to scale out capacity and stay ahead of your users’ needs.
Best practices for metrics
Through 10 years of experience in working on both engineering and ops teams I have found these metrics to be especially useful:
Number of calls to a given API (counter)
Number of user visits, tagged by page (counter)
Latency of DB calls (histogram)
Number of hits vs misses for a cache such as Redis (counter)
Size of DB scans/queries (histogram or gauge)
This can be auto-instrumented with some tools like DataDog as well; we do this.
Amount of resources(RAM/CPU) consumed by an instance(gauge)
The latency request calls correlated with a user type via label (histogram or gauge)
This will help you see if, while you’re experiencing latency issues, it’s a small number of very large users or a large number of very active users that are bogging down the service.
The number of request calls from a given user size (beware of high-cardinality metrics)
This will help when you figure out what kind of rate limit you’ll need to implement.
It's also important to get metrics emitted around the edges of your app. When your app calls out to other services or pieces of your infrastructure, count how many times it's occurring and get the latency of those calls.
If you do this right, you can sometimes tell when one of your downstream dependencies is in trouble before they know—which can lead to interesting conversations between teams, and usually some maturity of an organization's observability practices. But after reading this, you know you’re already on the path to adding the right instrumentation to your app. 🙂
Cleanup
Once you’re done with this example, follow these steps to clean up your environment.
Terminate the Prometheus container by running the following:
1docker kill prometheusFinally, go to the terminal where you are running your Flask app and hit Ctrl+c to terminate the app.
Thanks for coming along on this observability journey! You can download this tutorial here.


