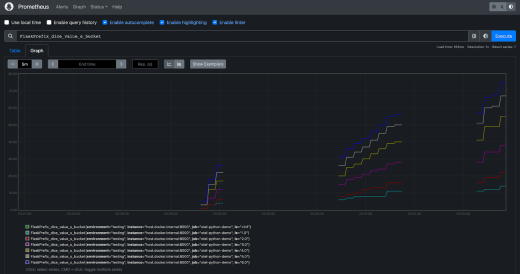
The three pillars of observability are:
Logging: your service emits informative messages that communicate user and system behavior.
Metrics: make and record certain measurements of your service at specific points in time.
Tracing: chaining together the calls your service makes, both calls between functions within your service and calls made between your service and others.
Today, we'll be focusing on tracing.
Tracing is very helpful when you get into the realm of distributed systems. Tracing allows you to map the path of your request as it’s handled by all services involved in fulfilling the request.
For data quality, tracing is a key tool for reconstructing the path(s) your data takes—some of which may not be immediately obvious, particularly in complex pipelines—and identifying the source of errors.
For this tutorial, we’ll once again be using OpenTelemetry, since it provides an open specification for system observability. We’ll pair it with a distributed tracing tool called Jaeger, which has OpenTelemetry Exporters and has recently been getting more traction in the Ops community with over 17.1k GitHub stars (It’s also been accepted into the CNCF as a project).
In this tutorial, we’ll create a couple of services talking to one another, emit spans via OpenTelemetry, then use Jaeger to piece the traces together.
Trace handling and span mapping
Distributed tracing is built off of spans.
Spans are logical units of work that have a name, start time, and duration. A trace is the grouping of all the spans generated by a system as it handles a request.
Jaeger documentation has a great visual of a trace:
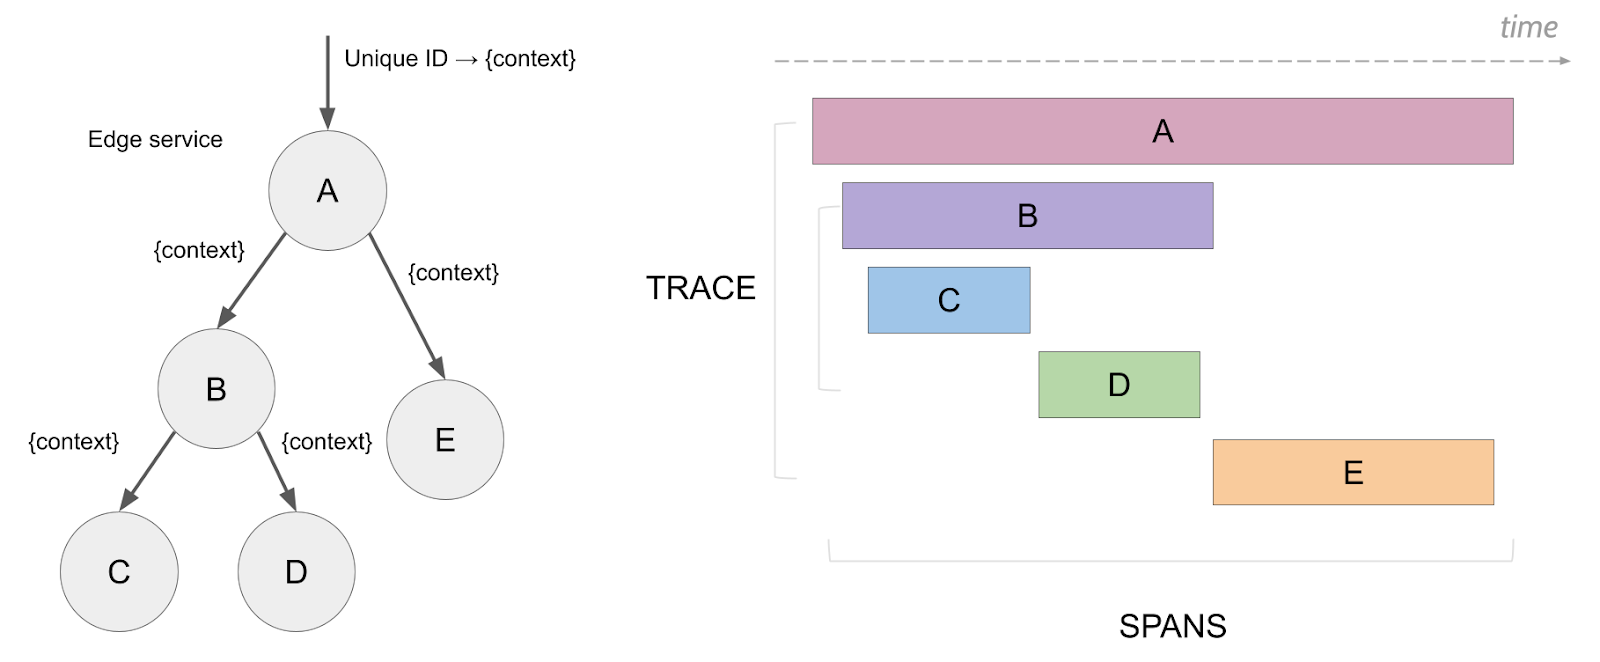
A trace has an ID, that is unique to the trace and shared by all of the trace’s spans. This trace ID is sent along with requests to a downstream service, so that the trace ID can be attached to any spans that the downstream service creates. More on the tracing standard used by OpenTelemetry can be found here.
A trace is created by collecting all spans associated with a given trace ID. Ordering the spans by operation start time creates the request’s order of operations. As traces start going across multiple services which are served from multiple servers, it’s important to make sure the server clocks are in sync so that the operation start times are organized correctly.
Before continuing to the rest of the tutorial, make sure you can do the following:
Ensure Docker is installed and running locally.
Ensure you have python and pip installed. I used Python 3.9.16
Git clone the tutorial code from GitHub and
Create a virtual environment and run
Jaeger: A distributed tracing service
Jaeger is an open-source distributed tracing platform that originally came out of Uber.
It has one or two traces that are put together right out of the box, so we can start it up and begin seeing some traces immediately.
Run the following Docker command to get Jaeger running locally.
1docker run -d- -name jaeger \2 -e COLLECTOR_ZIPKIN_HOST_PORT=:9411 \3 -e COLLECTOR_OTLP_ENABLED=true \4 -p 6831:6831/udp \5 -p 6832:6832/udp \6 -p 5778:5778 \7 -p 16686:16686 \8 -p 4317:4317 \9 -p 4318:4318 \10 -p 14250:14250 \11 -p 14268:14268 \12 -p 14269:14269 \13 -p 9411:9411 \14 jaegertracing/all-in-one:1.42Go to the Jaeger UI at http://localhost:16686, and you should see something like this:
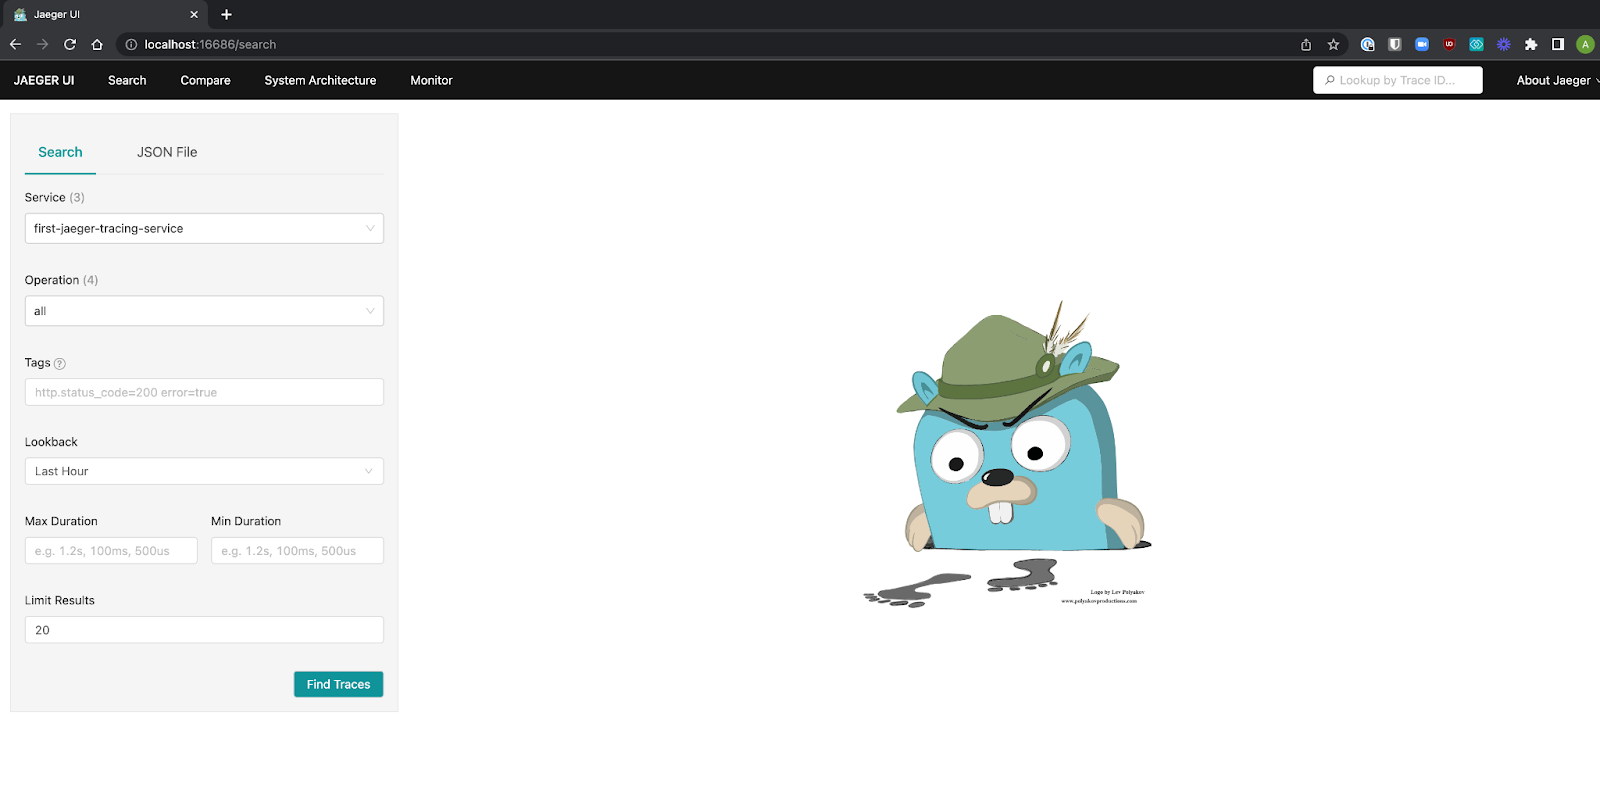
In the Jaeger UI we can start filtering traces by service, tags, or time, which is super convenient.
The feature I like the most in distributed tracing tools is the visualization of the service or system architecture. If you click into the “System Architecture” tab of Jaeger, you can see a view of what the request flows in your system look like between services.
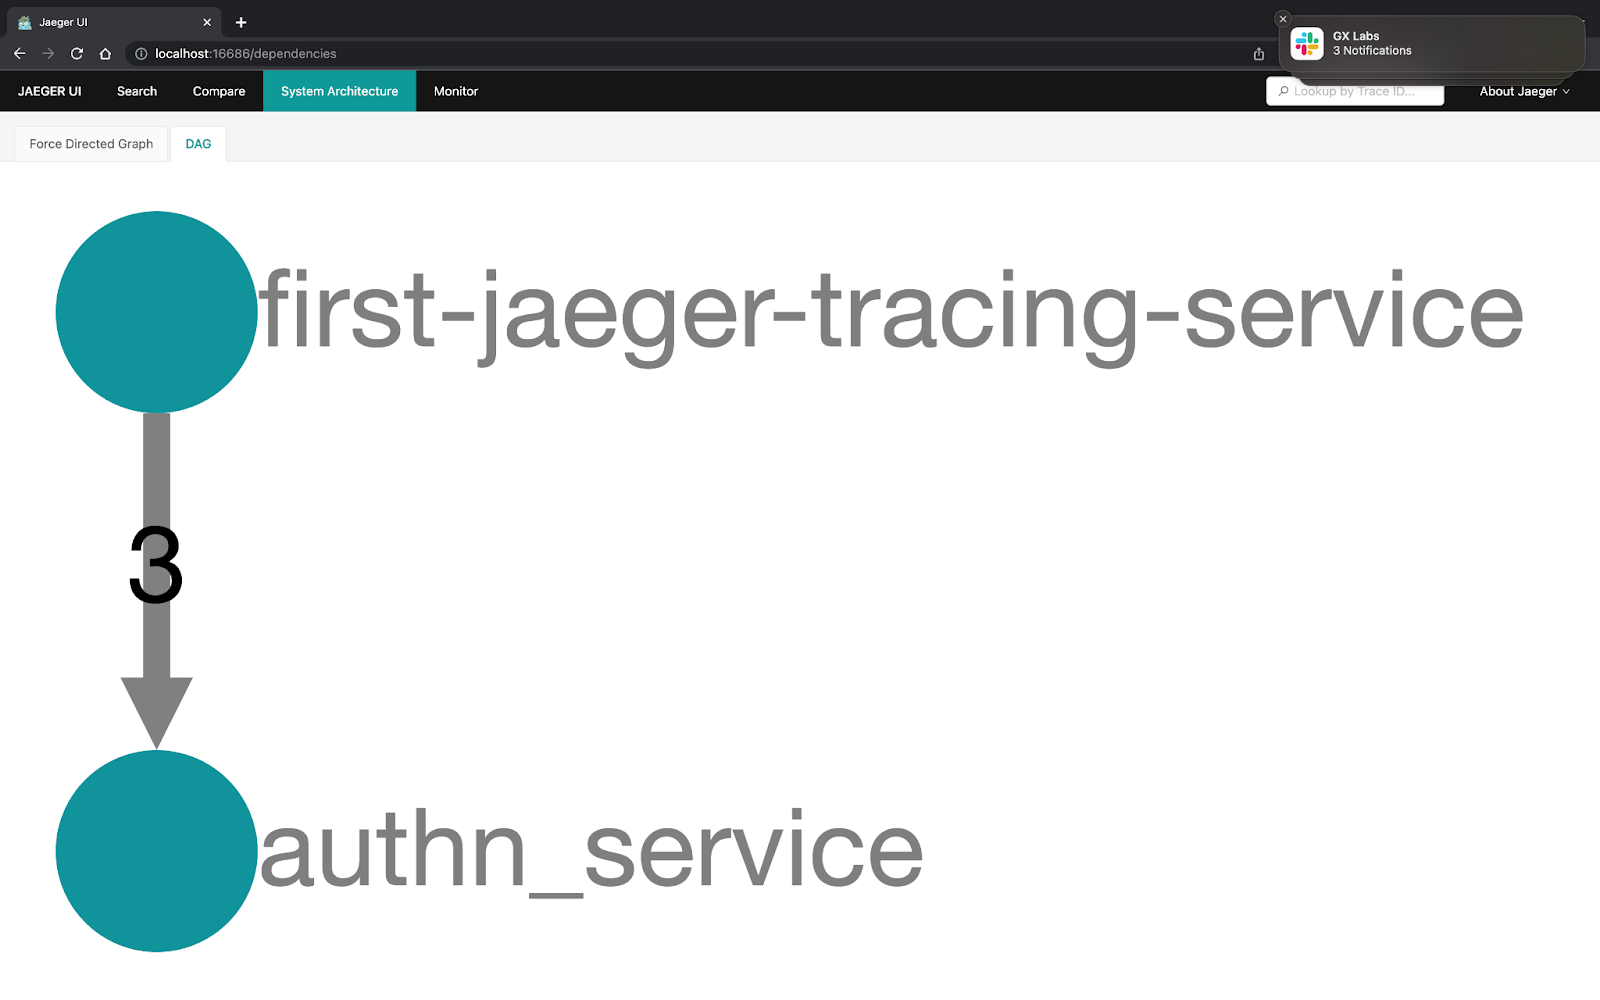
Now that we have somewhere to view our spans and assemble traces let's start creating our app.
NOTE: We’ll be doing manual instrumentation to show how spans are created and passed between different services or requests. There are ways to automatically instrument your app that you should use for production. Here’s an example for Flask.
Add a trace to an app server to show a simple request
To start off, ensure that you have cloned the GitHub repo to your local machine and met all of the requirements above.
Now open the
In this code chunk, we can see there are four main sections:
Package imports
OpenTelemetry configuration
Flask configuration
App routes
We’ve now configured OpenTelemetry to do the following:
Create and configure a tracer, which will allow us to start generating traces in our application.
Create a Jaeger exporter that will allow us to forward the spans and traces to Jaeger, where we can see them assembled.
Configure a span processor to forward spans to the previously-defined Jaeger exporter.
Add the span processor to the tracer. The tracer will use the span processor as a configuration to handle the spans it receives.
In the Flask route, we can see that this has something extra outside of the usual return value. A span is created using the
1pythonapp.pyNow open up your browsers to both localhost:16686 to see the Jaeger UI and localhost:5000 to fire off a request to our app.
Inside the Jaeger UI, you should now be able to see a new service,

This is pretty cool, but it's just the beginning. Let's see how to send traces between different services so we can get a better view of how our system is performing.
Multi-service traces
Now that we have a trace that consists of spans, how do we get that trace to include spans from other services?
In our case, we’ll first make and then call a mock authentication service, authn.
We could just wrap the whole request to authn in a span, but then we wouldn't know what was happening inside of the authn service or what amount of time was spent on internal processing inside the service versus time spent on the network between the services.
Since our two services will interact via an HTTP request, we can pass information back and forth in the headers. Specifically, we’ll get the trace ID from the parent span's context in the app service and forward it to our authn service in the request headers.
Let's look at the request and context header generated in the app service by app.py.
In the new
Inside the child span
We then take this carrier map that has had the context injected into it and add it to a header with the key
Let's spin up a service in the
In this file we have set up the same OpenTelemetry configuration as in the app service, but we’ve changed out the server name.
Inside of the
Having a way to track where your requests are flowing can help you learn more about the underlying systems, and using a visual flow UI of the service layouts makes this much easier than just tracking trace logs.
Let's start up our service. Run the following commands in separate terminals:
1#Service12pythonapp.py 3
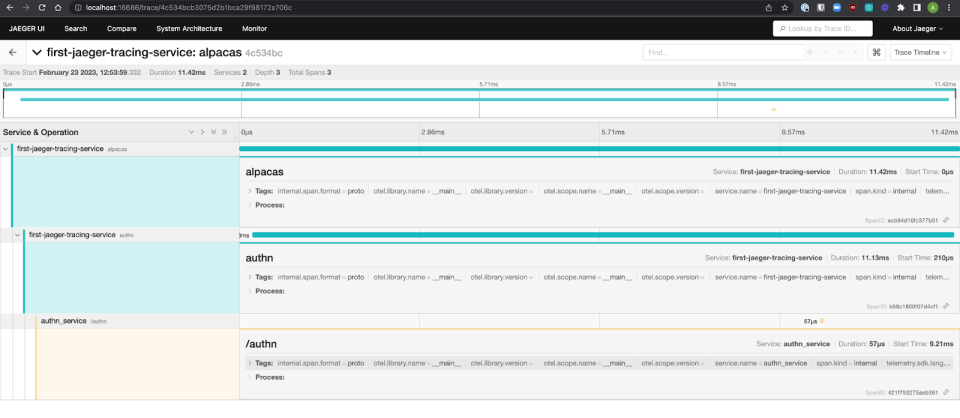
1#Service22pythonauthn.pyIf you now go to localhost:5000/alpacas, you’ll see a trace generated in the Jaeger UI that shows the two services and three different spans all connected in a single trace!
And if you go to Jaeger’s “Systems Architecture” tab, you’ll see the two services with requests flowing from your app to the authn service.
Congratulations: you’ve generated your first multi-service trace!
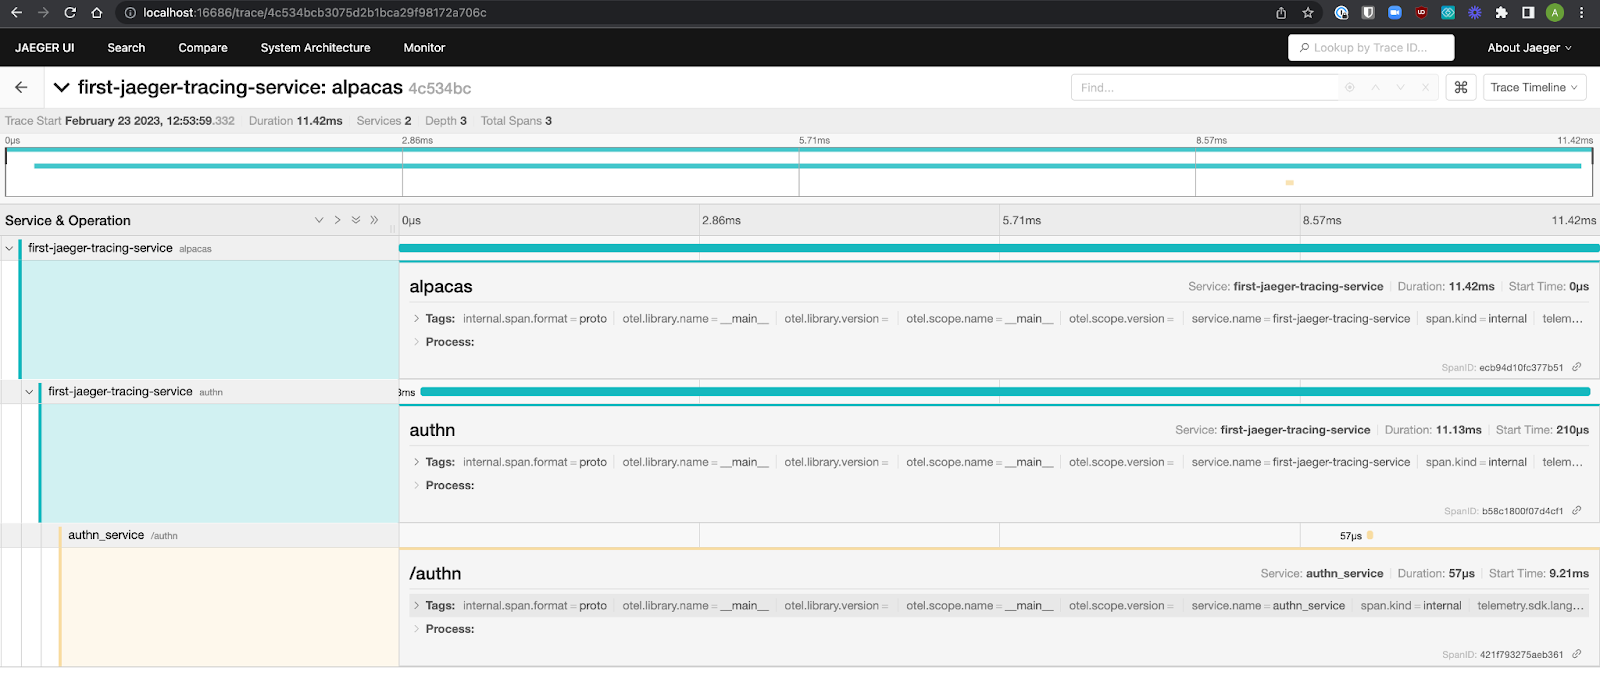
Tracing best practices
When implementing tracing in the past, the teams I’ve worked on found these guidelines helpful while going from having no traced services to many traced services:
Just start somewhere
An easy way to decide where to begin is to start with your most critical paths first, or the ones that are causing you the most issues, and expand from there.
For initiatives like this, start with a subset of teams or have an advocate on each team to lead this work.
Have rules for the services built, such as: if a trace ID is provided with a request, you must propagate that trace ID to all other called services even if you don't emit spans yourself, etc.
Make sure each service has only one name that's used consistently by all teams.
For services at your company, have a way to know which team owns them.
A simple way of doing this is in a service directory
Use sampling if there are too many traces.
Have a set of span tags that are consistent with all spans (service, server/region/node).
Thanks for coming along on this observability journey! You can download this tutorial here.
If you haven’t already, be sure to check out the first two parts of this series about getting started with logging and metrics.


